Work with data
Double-click a component to work with it. Once inside the component, you can right-click to access additional options.
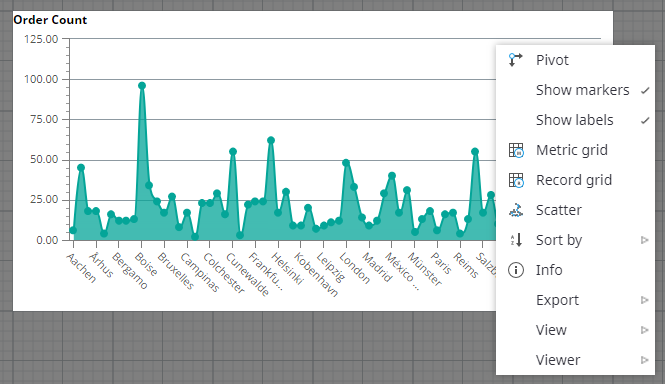
Preview
You can preview the charts as you edit and design them. There are two previewing options: Preview and Open in Viewer.
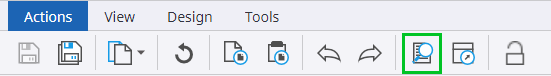
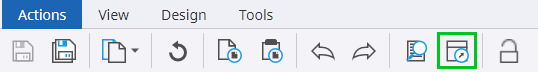
To open Preview:
-
Select
.
-
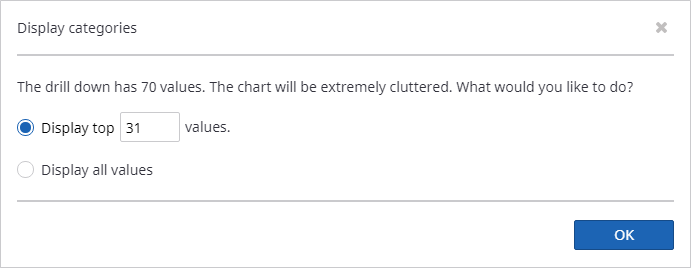
Since our sample chart contains too many values to fit on the screen, set
Display top 31 values when you are prompted.
-
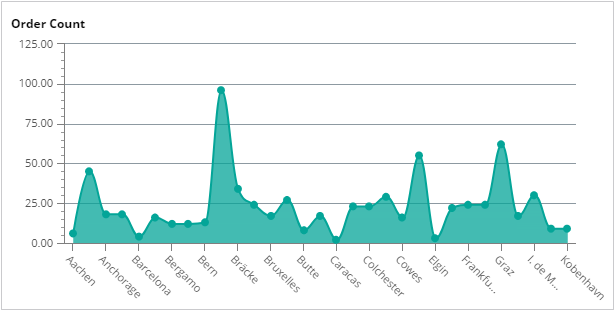
Click
OK to preview what users will see when viewing the charts you have created.
- To return to the Dashboard Designer, click the "x" button at the top right of the view bar. The Dashboard Designer is not explicitly labeled within Studio; navigate to the Views area to design a dashboard (see Add a new view).
View
To Open in Viewer, complete the following steps.
-
Select
.
-
A new browser window is opened to display the dashboard. As long as our sample chart contains too many values to
fit on the screen, set
Display top 31 values when prompted to do so.
-
Click
OK. A view is now displayed.
- To return to the Dashboard Designer, navigate back to the original browser window.