Statistics
The
Statistics link provides
access to statistic reports on packages activity for all the system users for
default or custom time period. Statistics is displayed in charts for its easy
reading. Hovering on charts displays the amount of packages for the chart unit.
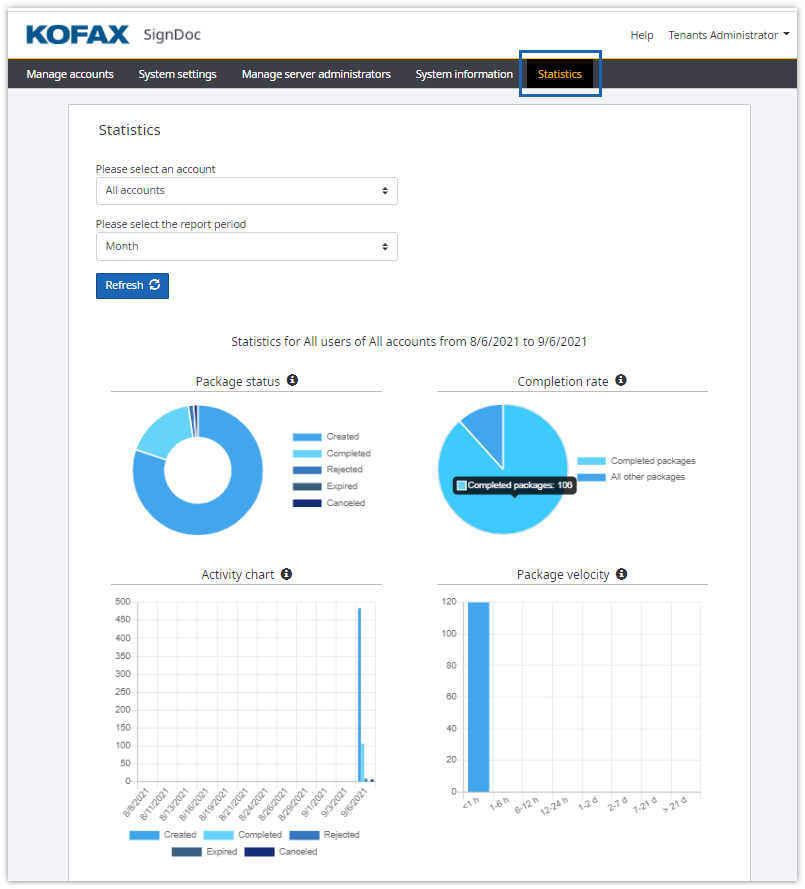
The following options can be specified:
- Account
- User (if account is specified)
- Time period
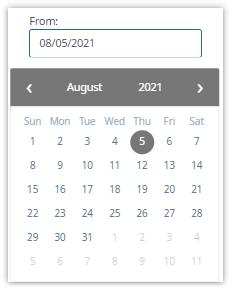
The time period selector allows to choose either default timeframes
(last day, last week, last month or last year) or to set your own timeframe by
selecting custom period and picking dates ‘from’ and ‘till’.
By default statistics page displays activity for all the accounts for the last month. After specifying different settings for account/user and time period and clicking Refresh new data according to selected parameters is displayed.
The statistics page provides reports on:
- Package status
- Completion rate
- Activity
- Package velocity
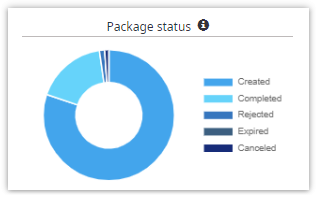
Package status
Package status chart demonstrates the amount of packages created,
completed, rejected, expired and canceled. It expresses a part-to-whole
relationship between different package states.
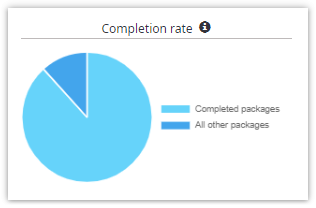
Completion rate
Completion rate chart displays share of completed packages to all the
finalized packages. It provides the proportion between positively finalized and
dismissed (rejected, expired and canceled) packages.
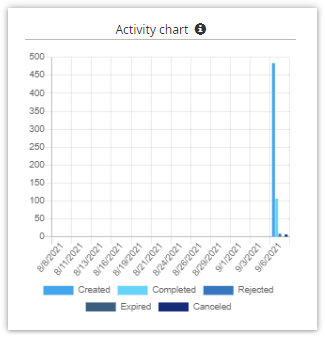
Activity chart
Activity chart displays dynamics of signing activity. It’s the bar chart
representing the amount of packages by state and time. Selected timeframe is
divided into 12 equal time units either it’s a year or a week. It provides
opportunity to see the dynamics for any selected timeframe.
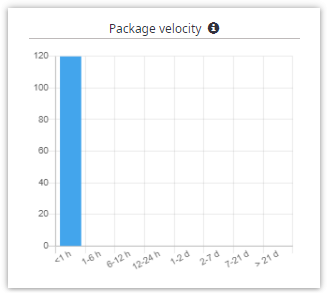
Package velocity
Package velocity chart demonstrates velocity of finalization of
packages. It shows how many packages were finalized (completed, rejected,
expired and canceled) for less then 1 hour, for 1-6 hours, for half a day, for
a day, two days, seven, twenty one or more than twenty one days.