Statistics
SignDoc Standard allows users with administrator rights to see
statistics on packages activity for all the account users. To see current
statistics click on
Statistics link. Statistics
is displayed in charts for its easy reading.
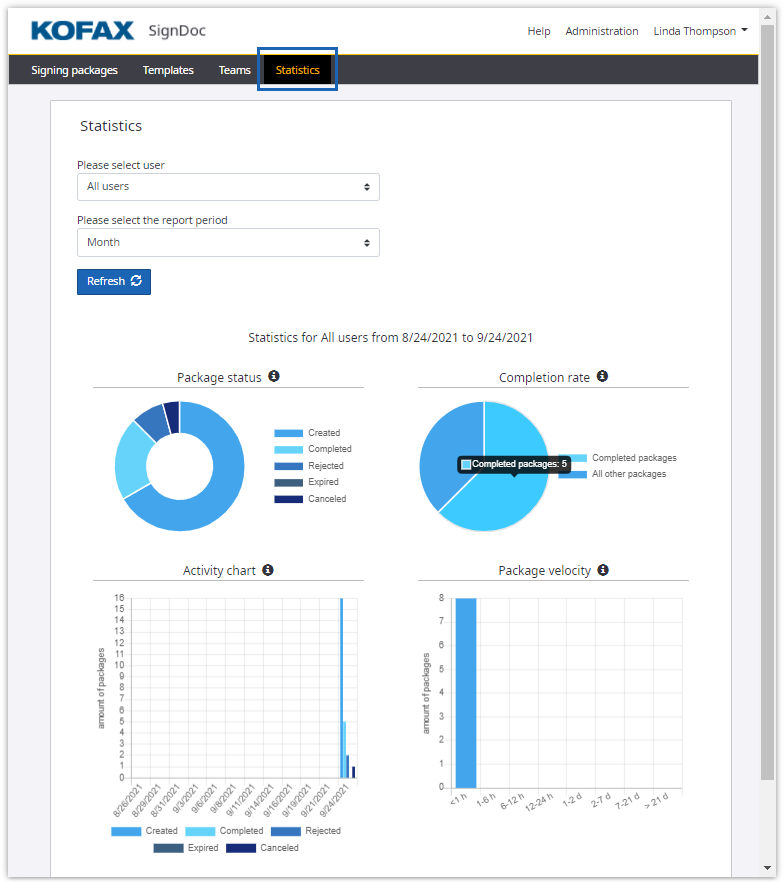
After the link is clicked the statistic data for all users of the account per month is displayed.
The following options can be specified:
- User
- Time period
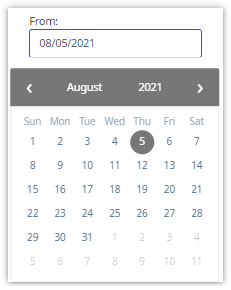
The time period selector allows to choose either default timeframes
(last day, last week, last month or last year) or to set your own timeframe by
selecting custom period and picking dates from and till.
After clicking Refresh the new data according to selected parameters is displayed.
The statistics page provides reports on:
- Package status
- Completion rate
- Activity
- Package velocity
Each graph is provided by information tooltip describing graph
specifics. To read about graph click on the icon.
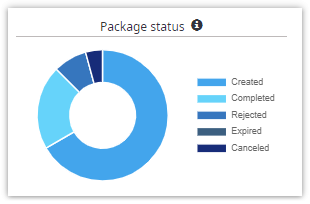
Package status
Package status chart demonstrates the amount of packages created,
completed, rejected, expired and canceled. It expresses a part-to-whole
relationship between different package states.
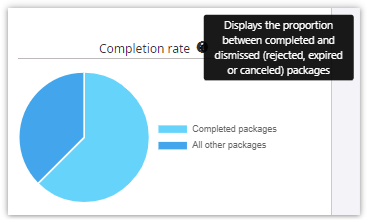
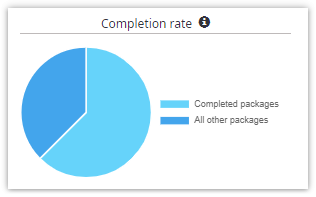
Completion rate
Completion rate chart displays share of packages completed to all the
finalized packages. It provides the proportion between positively finalized and
dismissed (rejected, expired and canceled) packages.
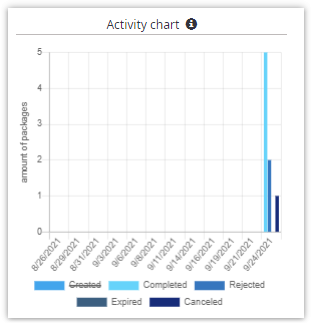
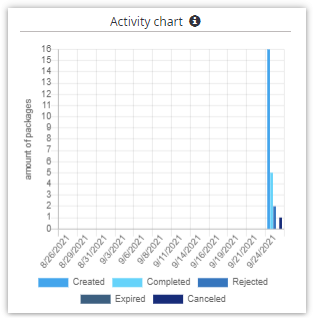
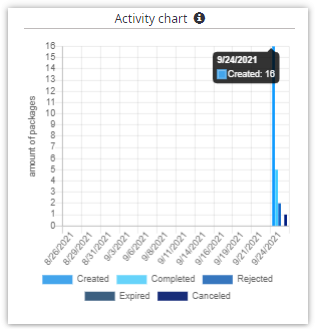
Activity chart
Activity chart displays dynamics of signing activity. It’s the bar chart
representing the amount of packages by state and time. Selected timeframe is
divided into 12 equal time units either it’s a year or a week. It provides
opportunity to see the dynamics for any selected timeframe.
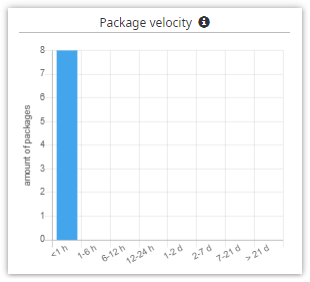
Package velocity
Package velocity chart demonstrates velocity of finalization of
packages. It shows how many packages were finalized (completed, rejected,
expired and canceled) for less then 1 hour, for 1-6 hours, for half a day, for
a day, two days, seven, twenty one or more than twenty one days.
Each chart has amount details and excluding data mechanism.
To get information about the amount of packages of specific unit hover
on data unit by mouse.
To exclude some data type from the chart representation click on the
excluding type in legend. To include click again. For example, if you would
like to exclude created documents on Package status chart you need to click
Created in legend of the
graph.